

Data Analysis for Cooling holes: Python
Spring - Fall 2022
This section is part 1 of the "Data Analysis for Cooling Holes" project. It gives an overview of the reporting methods I developed as a non-conventional process engineer. These tools are used to communicate weekly process status to upper management, and to diagnose and correct process problems.
Brief Cooling Hole Description

What are we measuring?
A Cooling Hole typically has two regions from which measurements are taken: the cylindrical thru-hole, and the conical diffuser.
There can be many critical cooling hole dimensions, per hole, depending on drawing requirements. In order to effectively communicate complex process status to management, I built a python script that transforms raw inspection and performance data into interpretable report formats. The script is also handy when compiling data for root cause corrective action and problem solving.
Part Process Path
Part
Operation 1
Machine A
Machine B
Machine C
Machine H
Operation 2
Machine D
Machine E
Machine F
Machine A
Operation 3
Machine G
Machine H
Machine I
Machine D
Dimensional Inspection
Inspection Machine 1
Inspection Machine 2
Inspection Machine 3
Inspection Machine 4
The part is processed through 3 different machining operations, passing through one machine per operation. Some machines are capable of conducting multiple operations.
My script pulls part data off of the machines, in the order that the parts were processed. This part ordering is important when conducting root cause corrective analysis. At this point, an initial list of parts to get data for is created.
The cooling hole features are measured on a CMM platform
Once the part completes inspection, raw dimensional data is saved in folder locations by serial number. My script finds each part on the initial list and pulls the raw dimensional data.
Performance Inspection
Inspection Machine 1
Inspection Machine 2
The part undergoes a performance test, consisting of 4 different sub-tests.
All part performance data is saved to a database. My script searches the database to find parts compiled in the initial list and pulls the performance data.
Sample Report

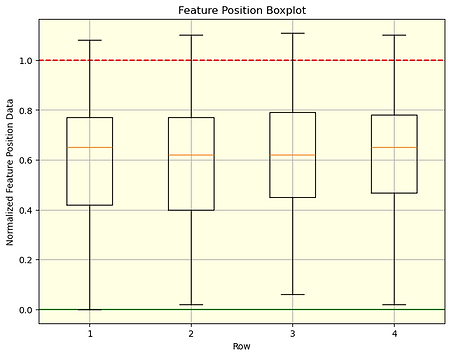


Note: For NDA purposes, all of the data shown in this report and on this page was generated independently. It does not represent any real production data.


Script Samples
Below are some excerpts from the script that generates the above report. Please note: In accordance with a signed NDA all script samples were created independently for the purposes of this project overview. The script does not apply to any existing manufacturing process or data formats.

User Defined Function: Returns Process Limit based on user input

User Defined Function: Combines Python Dictionaries without excluding non-common data.

User Defined Function: Used for converting process cycle times


User Defined Function: Returns Date-Time input as Timestamp with formatting error proofing built in